Four charts that capture U.S. solar deployment in 2023
For the first time, solar represented over half of the power added to the grid.


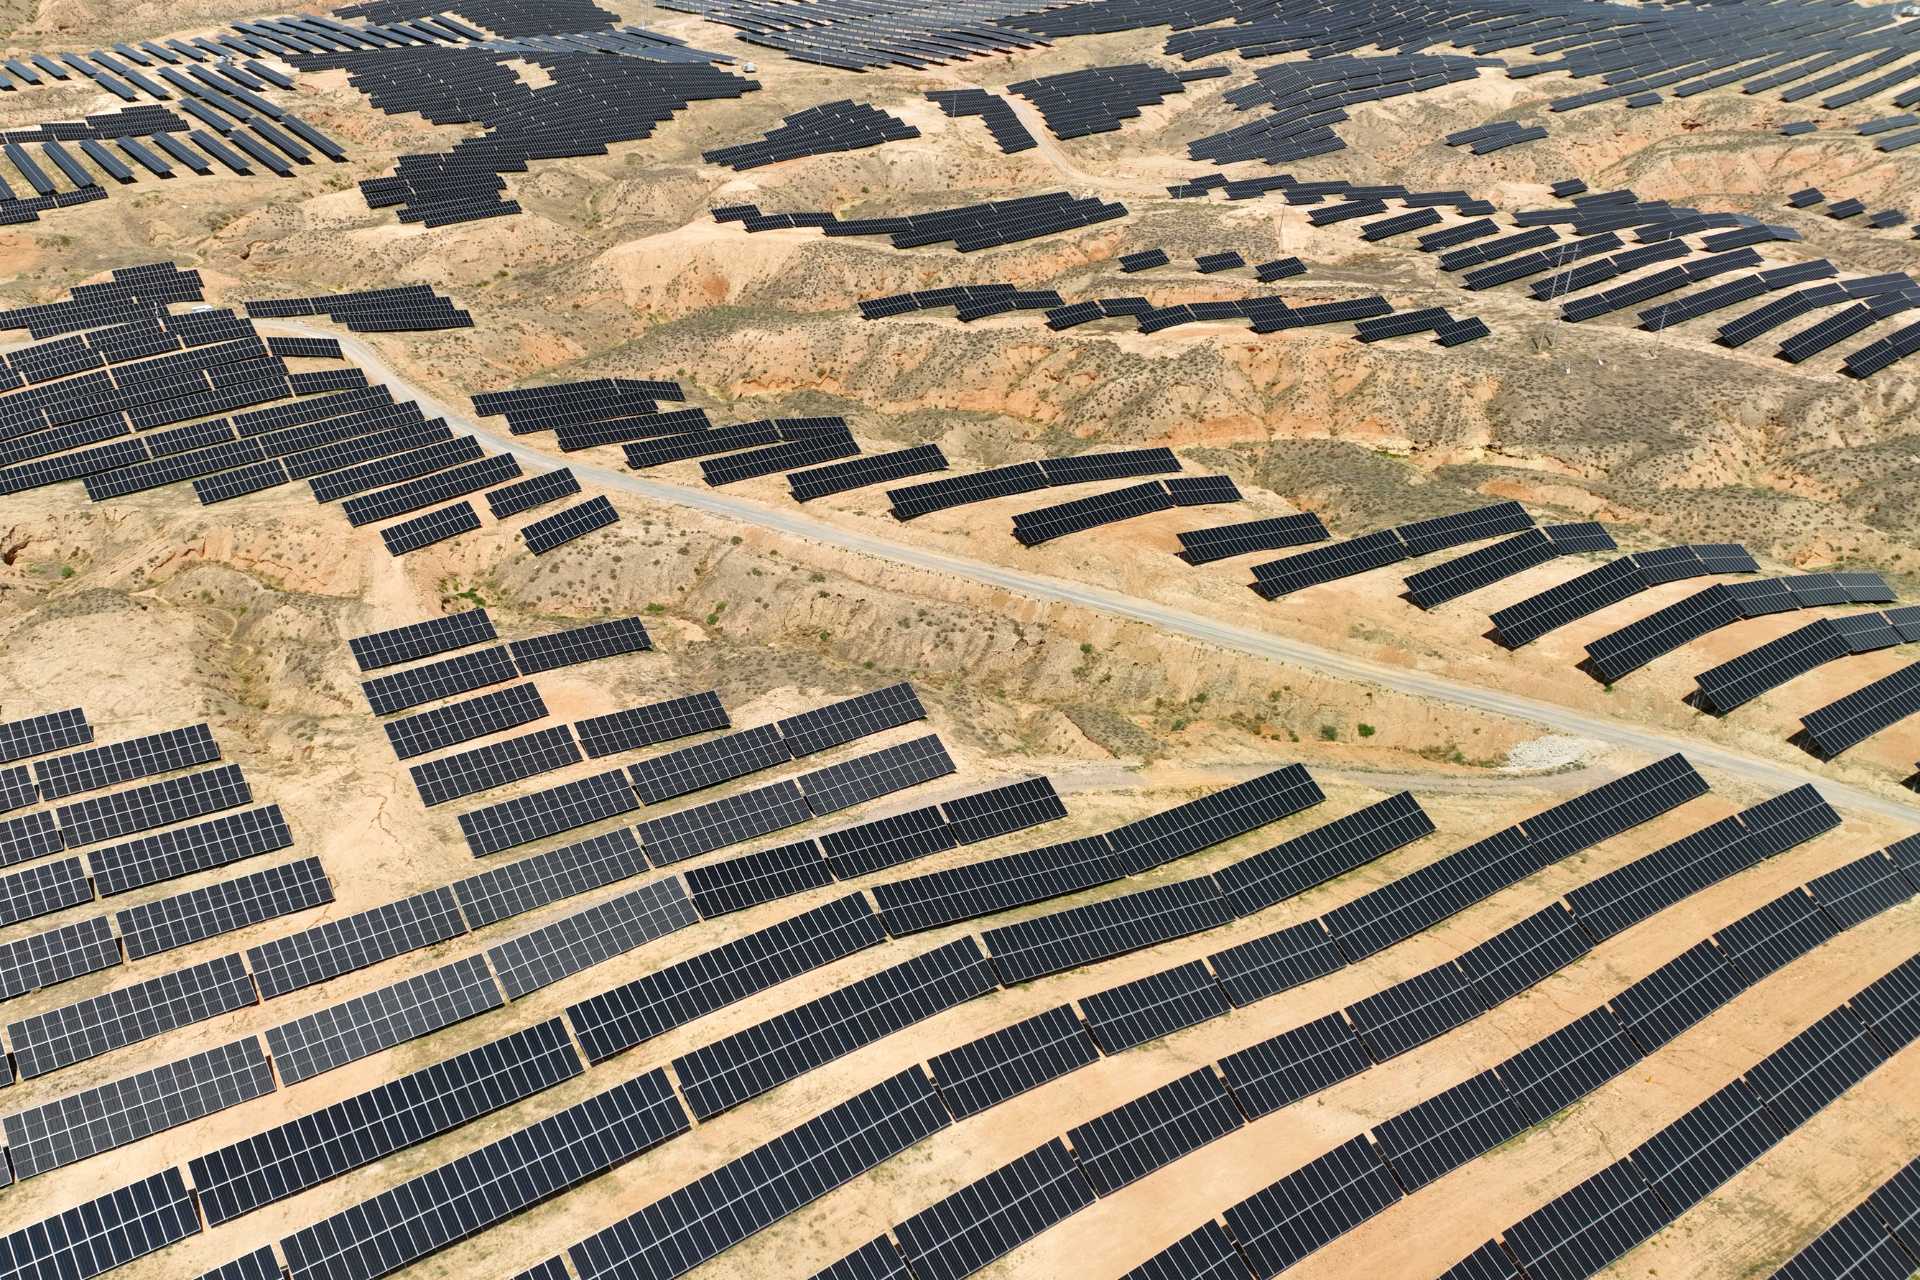
Photo credit: Yuan Hongyan / VCG via Getty Images
Photo credit: Yuan Hongyan / VCG via Getty Images
It was another record-setting year for U.S. solar deployment — even though not all was rosy for the industry in 2023.
For the first time, solar represented over half of the electricity added to the United States grid, according to a report from the Solar Energy Industries Association and Wood Mackenzie, out today. This amounted to a whopping 32.4 gigawatts, a 37% jump from the previous, 2021 record.

The analysis found that 53% of the electricity added to the grid was from solar. Meanwhile, 13% was from wind — a much smaller share than in recent years. Natural gas continues to hover at just under 20% of the year's added capacity.
Broadly, 2023 was a year of tumult in the market, as module prices fell roughly 10-15%, necessary equipment was delayed, and interconnection constraints remained a problem. Nonetheless, the report characterized 2023 as “a year of recovery” for the market after a shrinking in light of trade actions and supply chain problems in 2022.
While residential solar specifically also set an annual record of 6.8 GW installed last year, installations dropped in the fourth quarter of the year “as the large pipeline of California projects sold under more beneficial net metering rules in early 2023 was built out,” the report found.

Going forward, the trend of installation growth is expected to continue, with a lull in the near-term. This projected 13% contraction in 2024 is due to both high interest rates and the net metering transition in California.
“We expect a 40% reduction in California’s installed capacity in 2024, leading to a nationwide contraction of the residential solar market,” the authors added.
Utility-scale installations of course dominated the market, at 22.5 GW of capacity, a 77% increase over 2022. The fourth quarter was particularly robust, in light of record imports before a key tariff waiver expires this coming June.
Commercial solar also increased to 1.9 GW installed in 2023, which represents a 19% increase over 2022. Community solar saw a much smaller increase of just 3%, but the report expects the market to pick up speed in the coming years, given large development pipelines and new funding.
California had a long reign as the top destination for solar installations, but Texas installed more solar in both 2021 and again in 2023, thanks to some particularly big utility-scale projects.

But Colorado and Ohio are perhaps the report’s bigger story: both states jumped from near the middle of the pack in terms of solar installations by state, to spots four and five, respectively.
Meanwhile, solar PV system prices fell slightly in both the residential and commercial sectors. But utility-scale pricing for both fixed-tilt and single-axis tracking systems increased from 2022 rates. While prices of the modules have dropped year-over-year in the residential sector especially, customer acquisition and overhead costs remain a stubbornly high share of the total price.

Going forward, solar and battery storage together are forecasted to make up of 81% of new generation capacity in 2024, according to a separate report from the Energy Information Administration, released in February.
By 2034, the SEIA and WoodMac “base case outlook” (read: neither a bearish nor a bullish outlook) found that solar deployment is expected to grow to over 670 GW in the next decade, nearly quadrupling the amount on the grid today. Typical yearly volume of installed capacity is expected to be roughly 48-50 GW from 2030 onward.
.jpg)